Monitoring CPU and memory performance is essential for maintaining the health and stability of your Windows Server 2012. In this post, we’ll show you how to use the Server Manager tool to keep an eye on these vital system resources.
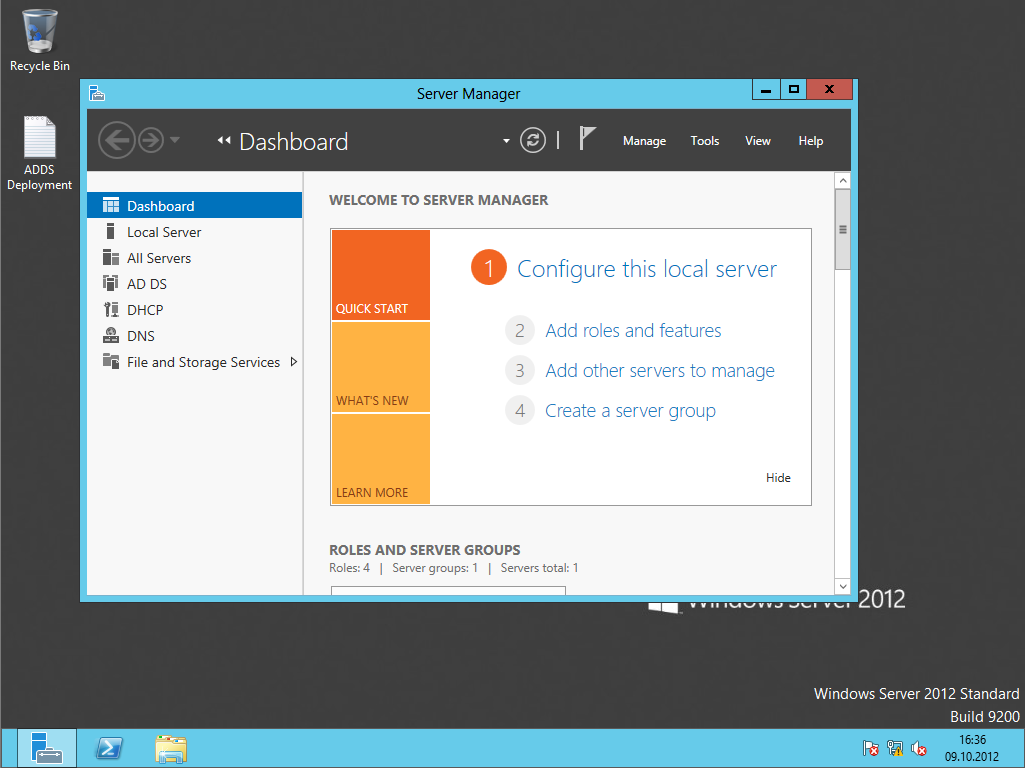
Step 1: Open Server Manager
First, open the Server Manager tool by clicking on the Server Manager icon in the taskbar, or by pressing the Windows key + X and selecting Server Manager from the menu.
Step 2: Navigate to Performance Monitor
In the Server Manager window, click on the “Performance Monitor” option in the left-hand navigation pane.
Step 3: Select Performance Counters
In the Performance Monitor window, click on the green plus sign icon to add a new performance counter. Here, you can choose from a wide variety of performance counters, including CPU usage, memory usage, disk usage, and network usage.
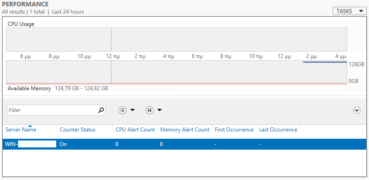
After a couple of minutes, you will see the graphs filling up with data.
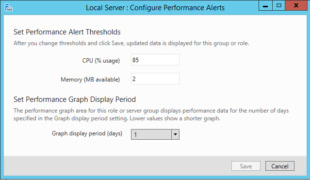
** Additionally you can turn on Performance Alerts and alter the Performance Graph Display Period ( starting from 1 to 7 Days ). To do so, at the Performance Section click Tasks and set the Graph display period and Alerting Thresholds according to your needs.
Step 4: Customize the Display
Once you’ve selected your desired performance counter(s), you can customize the display to make it more visually appealing. For example, you can change the color of the graph, add a title or description, or adjust the scale of the graph.
Step 5: Save Your Custom Display
Finally, you can save your custom display for future use by clicking on the “Save” button in the top right-hand corner of the window.
By following these simple steps, you can easily monitor CPU and memory performance on your Windows Server 2012 using the Server Manager tool. With this information at your fingertips, you can quickly identify and resolve any performance issues before they become a problem.
Thanks for reading my blog!
You must be logged in to post a comment.